Risk matrices are embedded in maritime risk assessment. They give a structured workshop a common language: a scenario is placed against a likelihood category and a consequence category, and the intersection produces a ranking that a multidisciplinary team can discuss and act on.
The output of that exercise depends on two things. The first is the hazard. The second is the instrument used to classify it. For established systems the second contributes little, because the categories have been calibrated against decades of operating experience. For technologies entering maritime service with a thinner evidence base, the contribution of the instrument becomes larger — and less visible.
A categorisation tool, not a measurement
A risk matrix divides two continuous quantities, frequency and severity, into a small number of bands, and assigns a ranking to each combination. IEC 31010 lists the consequence–likelihood matrix among the techniques available for assessing risk, alongside methods that estimate frequency and consequence explicitly.
The distinction matters. A matrix sorts scenarios into predefined groups. It does not estimate how often an event occurs or how far a release travels. Two scenarios separated by an order of magnitude in frequency can occupy the same likelihood band, and two consequence mechanisms that differ in escalation potential can occupy the same severity band. Once placed in a cell, those differences are no longer visible in the output.
That compression is the intended behaviour of the tool. It becomes a problem only when it removes the distinctions the decision depends on.
Why the upper bands fill
When a hazard identification study of an alternative-fuel installation produces a register dominated by high rankings, three distinct mechanisms are usually at work. They have different implications, and separating them is the first analytical step.
The study may be ranking inherent rather than residual risk. If scenarios are assessed without crediting the safeguards already present in the design, a concentration in the upper bands is the expected and correct result. The difficulty arises when inherent and residual rankings appear in the same register without being distinguished, which happens more often than it is acknowledged.
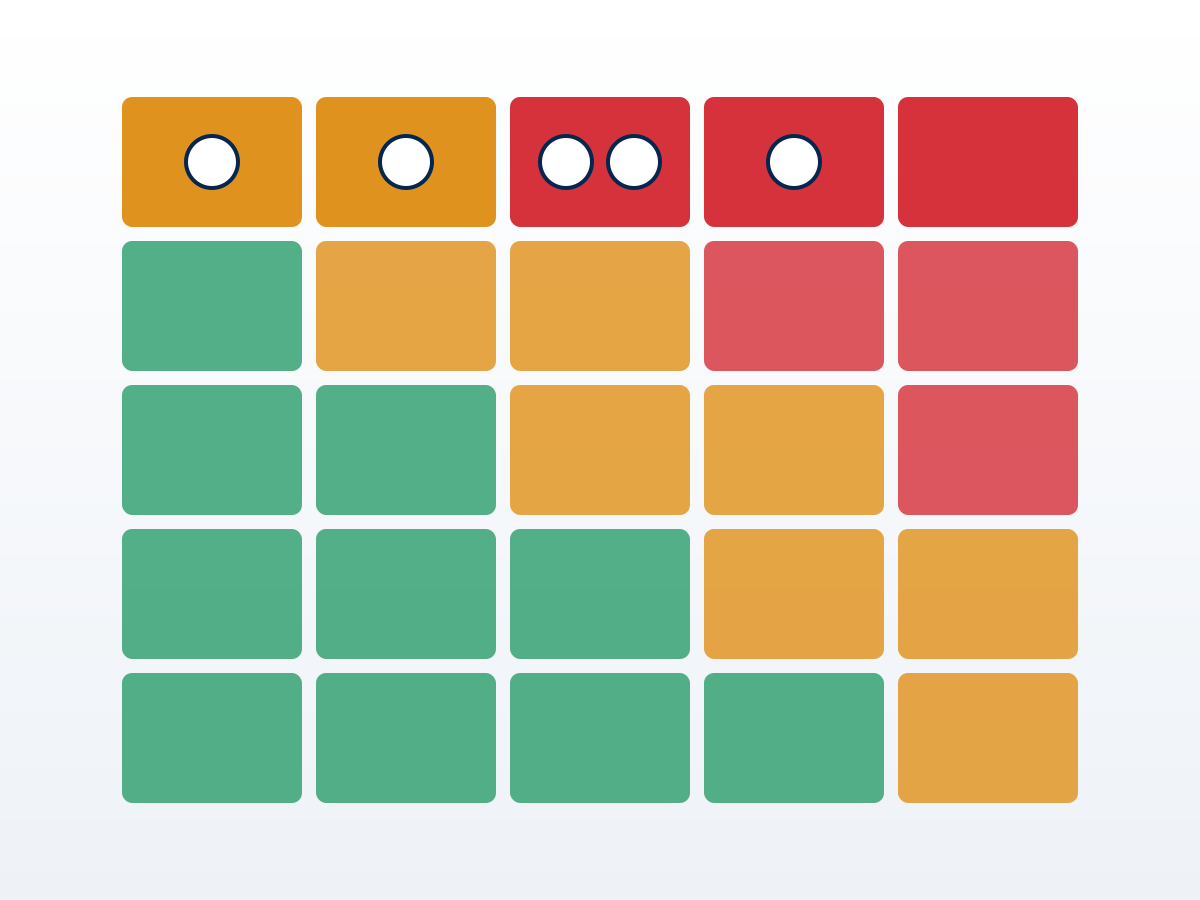
The consequence axis may have saturated. This is the mechanism that most often goes unexamined. For a toxic or flammable fuel, the great majority of credible loss-of-containment scenarios reach the highest consequence band, because that band is usually defined by multiple fatalities. A small release in an enclosed space and a major failure at the bunkering interface both qualify. The consequence axis therefore stops discriminating between them, and the entire separating function of the matrix falls to the likelihood axis — which, for an emerging technology, is the axis supported by the least evidence.
Likelihood may be assigned conservatively under uncertainty. Where maritime operating history, failure-rate data and casualty experience are limited, teams reasonably fall back on analogous industries, modelling, experimental results and engineering judgement. Conservatism in that situation is appropriate. Combined with a saturated consequence axis, it moves large parts of the register into the same region.
None of these mechanisms means the assessment is wrong. The risks may genuinely require further control. What they mean is that the register has lost resolution, and a register without resolution cannot perform the function it was built for — showing the project which scenarios deserve attention first.
Changing the instrument does not change the hazard
Risk matrices are not standardised across the industry. Organisations define likelihood bands over different frequency ranges, build consequence categories around different combinations of personnel, environmental and asset outcomes, and place the boundary between tolerable and intolerable risk in different cells. The same scenario, assessed by the same team with the same technical judgement, can therefore carry different rankings under different matrices.
This observation is not new. Risk-analysis literature has examined the consequences of categorisation at length, including the resolution limits of coarse bands and the conditions under which a matrix can rank two scenarios inconsistently with their underlying quantitative risk.
The practical conclusion is narrow but important. Where the ranking is sensitive to the choice of matrix, selecting a different matrix because its output looks more reasonable is not a resolution. Risk acceptance criteria belong to the methodology, established before the assessment and applied consistently through it. A matrix chosen after the results are known no longer provides an independent test of anything.
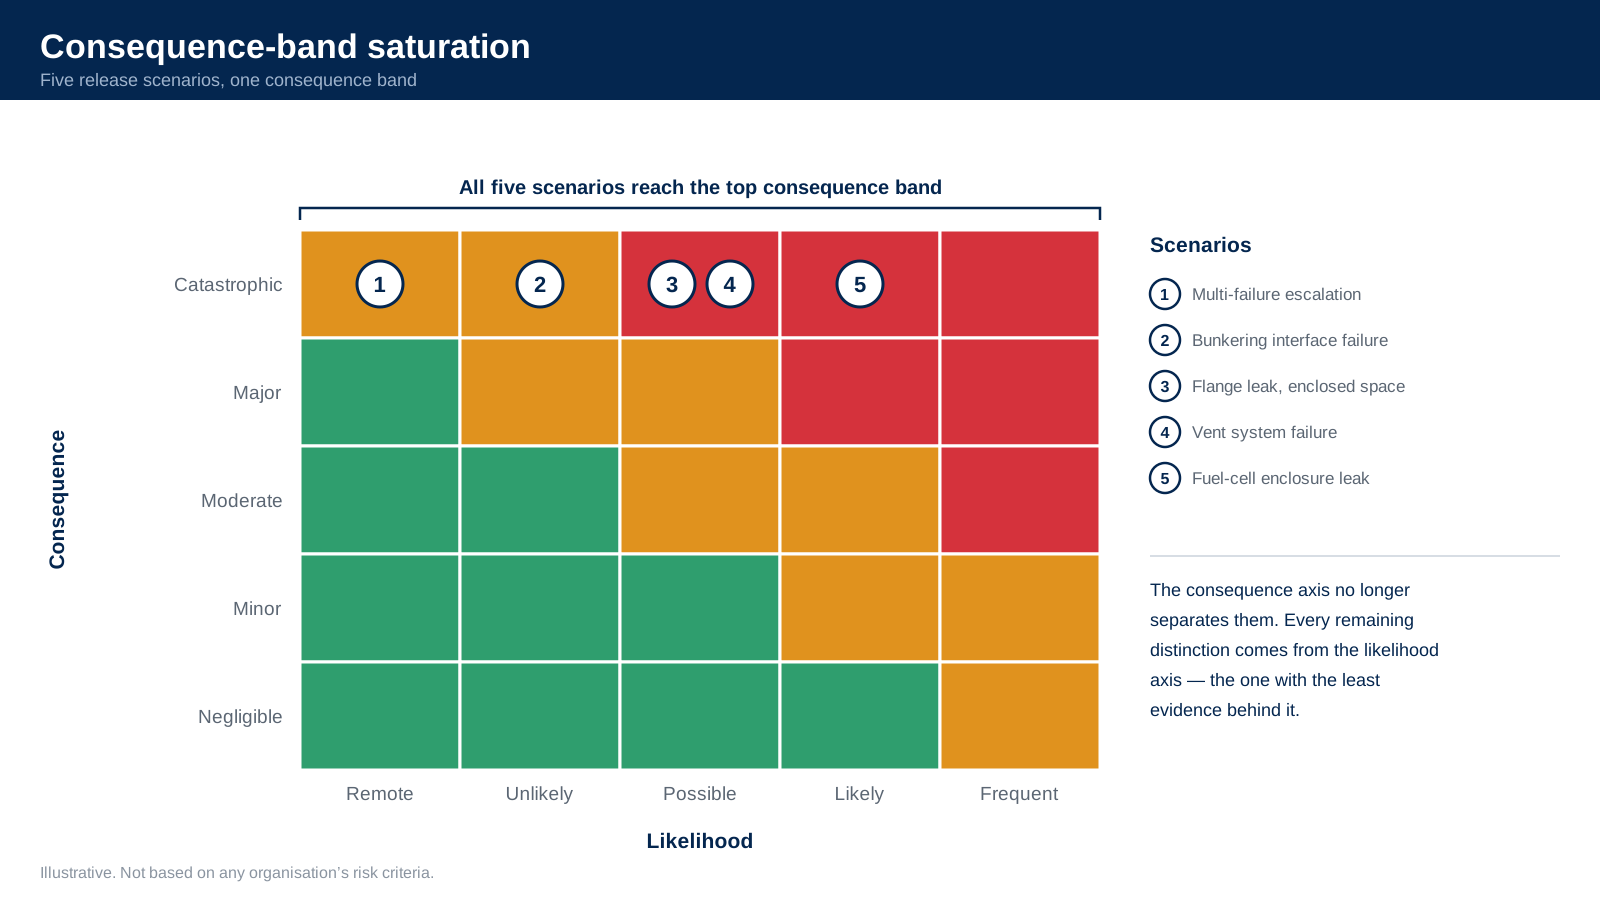 Consequence-band saturation: five scenarios, one consequence band. Illustrative only — not based on any organisation's risk criteria.Source: ICORA MED
The useful response to a saturated register is to examine what produced it: whether safeguards were credited consistently, what each consequence category actually represents for this installation, how wide the frequency bands are, and whether a reasonable change in an assumption would move a scenario across a boundary.
Recording the basis of the judgement
A frequent proposal is to add uncertainty to the matrix as a third dimension. The intent is sound, but a three-dimensional matrix is not usable in a workshop.
A more practical approach keeps the matrix as it is and records, for each scenario, the basis on which the likelihood was assigned: maritime operational data, data from an analogous industry, a model, experimental evidence, or expert judgement alone. The result is a short annotation beside the ranking rather than a change to the tool.
That annotation carries information the colour cannot. Two scenarios in the same cell, one supported by failure-rate data and one by judgement under acknowledged uncertainty, call for different treatment. The IMO guidelines for formal safety assessment make a related point in addressing the reliability of data and the need to report assumptions and limitations alongside results.
Proportionate analytical depth
Hazard identification is a screening process. Its strength lies in identifying hazards, challenging the design and establishing where further work is justified — not in quantifying every scenario it records.
For many scenarios a qualitative or semi-quantitative ranking is sufficient to support the decision. For a smaller number, particularly those combining severe consequences with uncertain frequencies or marked sensitivity to assumptions, the ranking indicates that the screening stage has reached its limit. Consequence modelling, barrier analysis, fault and event tree analysis, failure modes and effects analysis, layer of protection analysis and quantitative risk assessment each extend the analysis in a different direction, and the appropriate choice depends on what the decision requires.
The principle is proportionality. Greater uncertainty and greater potential consequence justify greater analytical depth, rather than a further iteration within the same screening tool.
The matrix locates the question
Risk matrices remain useful for the purpose they serve. They are transparent, they support structured discussion across disciplines, and they document a team's reasoning in a form others can review.
The alternative-fuel transition does not make them obsolete. It makes their calibration consequential, because the technologies now being assessed sit further from the operating experience the categories were drawn against.
For an installation using hydrogen, ammonia or a fuel cell system, the most useful reading of a concentration of high rankings is not that the design is unacceptable, nor that the matrix is unsuitable. It is that the screening stage has identified where the analysis needs to continue.
Sources and further reading
- IEC 31010:2019, Risk management — Risk assessment techniques. Describes the consequence–likelihood matrix alongside the other techniques available for assessing risk, and the conditions under which each is appropriate.
- Cox, L. A., Jr. “What's Wrong with Risk Matrices?” Risk Analysis, vol. 28, no. 2, 2008, pp. 497–512. Examines resolution limits, range compression and the conditions under which a matrix can rank risks inconsistently with their quantitative values.
- International Maritime Organization. Revised Guidelines for Formal Safety Assessment (FSA) for Use in the IMO Rule-Making Process, MSC-MEPC.2/Circ.12/Rev.2. Addresses the objective review of incident and operational data and the reporting of reliability, uncertainty and validity; see also IMO's overview of formal safety assessment.
- International Maritime Organization. Interim Guidelines for the Safety of Ships Using Fuel Cell Power Installations, MSC.1/Circ.1647.
- International Maritime Organization. Interim guidelines for the safety of ships using hydrogen as fuel, MSC.1/Circ.1701, listed with IMO's other alternative fuel and technology safety guidelines, including those for ammonia (MSC.1/Circ.1687) and methyl/ethyl alcohol (MSC.1/Circ.1621).